
The S&P 500 and Nasdaq Composite closed at all-time highs on Tuesday, with the Dow Jones Industrial Average breaching 51,000 for the first time to settle at 51,078.88, while the S&P 500 hit 7,599.96 and the Nasdaq reached 27,086.81. The rally, fueled by stellar corporate earnings and a dovish Federal Reserve posture, capped a winning month for equities. Yet beneath the headline records, a troubling divergence is emerging: only 60% of S&P 500 constituents are trading above their 200-day moving average, a measure of intermediate-term trend participation. That figure, down from over 80% in January, signals that the market's advance is increasingly driven by a shrinking cohort of mega-cap stocks rather than broad-based participation. The narrow leadership raises the question of whether the rally is sustainable or whether it is setting up for a sharp reversal when concentration unwinds. This matters now because history shows that when breadth deteriorates this severely while indices print new highs, the subsequent drawdowns tend to be deeper and faster than in well-breadth rallies. The current setup mirrors patterns seen before the 2022 correction and the 2000 tech bust.
The 60% breadth threshold and its historical track record
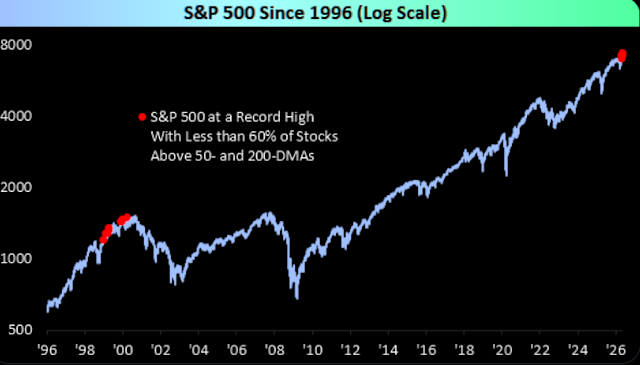
The 200-day moving average is a widely followed technical indicator that smooths out daily price fluctuations to reveal the underlying trend of a stock over roughly 40 weeks. When a stock trades above this line, it is considered to be in a long-term uptrend; below it signals a downtrend. The percentage of S&P 500 stocks above their 200-day average is a standard breadth metric used by institutional traders and quantitative funds to gauge the health of the rally. At 60%, the current reading means that 200 of the 500 index members are trading below their long-term trendlines even as the index itself sits at a record. This divergence is mathematically possible because the S&P 500 is market-cap weighted: a handful of mega-cap names, specifically Apple, Microsoft, Nvidia, Amazon, Meta, Alphabet, and Tesla, now account for roughly 30% of the index's total market capitalization. When those seven stocks rally, they can lift the entire index even if the remaining 493 stocks are flat or declining. The 60% figure is not a crash signal by itself, but it marks a threshold that has historically preceded periods of elevated volatility. In late 2021, the same metric dipped to 55% while the S&P 500 continued to rise, and the index subsequently fell 25% over the next 12 months. The current reading, while not as extreme, is trending in the same direction. The 200-day moving average breadth metric has been tracked by institutional desks for decades, and its current level sits in the bottom quartile of all readings since 1990.
How the money flows through the P&L
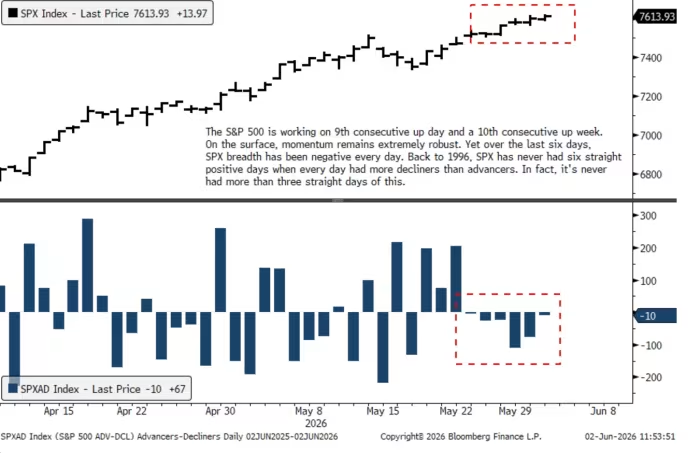
The concentration of returns creates a self-reinforcing dynamic that distorts capital allocation across the market. Active fund managers, benchmarked to the S&P 500, face mounting pressure to overweight the mega-cap winners simply to keep pace with the index. This flows directly into the P&L of asset managers: those who underweight the top seven stocks have underperformed by an average of 400 basis points year-to-date, according to recent performance dispersion data. The result is a crowding effect that pushes more capital into the same names, further inflating their valuations and compressing the breadth even more. On the corporate side, the mega-cap companies themselves benefit from lower cost of capital as their stock prices rise, enabling them to issue equity or convertible debt on favorable terms for acquisitions and capital expenditure. Nvidia, for example, has used its elevated stock price to fund a series of bolt-on AI startups. Meanwhile, the 200 stocks below their 200-day average face the opposite dynamic: their equity becomes more expensive as a funding tool, and their ability to attract talent through stock-based compensation weakens. For companies in the Russell 2000, which is dominated by smaller firms, the divergence is even starker: only 45% of small-cap stocks are above their 200-day average, a level that historically correlates with tighter credit conditions and higher default risk.
The winners and losers in the market structure
The primary winners in this environment are the mega-cap technology and AI-related stocks that have driven the index to records. Nvidia, Microsoft, and Meta have each posted gains exceeding 30% year-to-date, powered by the AI capex cycle and robust earnings beats. The Federal Reserve's accommodative stance, keeping the fed funds rate steady while signaling potential cuts later in the year, has provided a tailwind for long-duration growth stocks, which benefit most from lower discount rates. The losers are the vast majority of S&P 500 constituents that lack the AI narrative or the scale to command premium valuations. Ford, for instance, saw its stock surge from strong EV transition execution, yet its 15% year-to-date gain still lags the S&P 500's 18% return. The broader industrial, financial, and consumer discretionary sectors are seeing their relative performance compress as capital flows concentrate. The Federal Bank Limited, an Indian bank with a market cap of 712.07 billion rupees and a PE ratio of 16.53, offers a contrasting case: its 1-year return of 40.95% and 5-year return of 245.08% demonstrate that strong breadth can exist in local markets even as the U.S. large-cap index narrows. The divergence between the S&P 500's headline performance and the median stock's experience is creating a two-tier market that penalizes diversification and rewards concentrated bets. This structure is one that active managers are finding increasingly difficult to navigate.
Downstream effects on capital markets and regulation
The narrow breadth has second-order effects that ripple through the capital markets ecosystem. Index rebalancing, which occurs quarterly, forces passive funds to buy more of the mega-cap stocks as their weights increase, mechanically amplifying the concentration. The S&P 500's top 10 stocks now account for 35% of the index, up from 27% a year ago, and the next quarterly rebalance in June will push that figure higher. This creates a feedback loop that distorts the risk profile of the trillions of dollars in passive index funds and ETFs. Regulators at the SEC and the Federal Reserve are paying close attention. The Fed's Financial Stability Report, released in May, flagged "elevated asset valuations and narrow market breadth" as a vulnerability, noting that a sudden reversal in risk appetite would trigger a disorderly unwind. On the regulatory front, the SEC is considering new rules that would require large asset managers to disclose their concentration risk in 13F filings, a move that would accelerate a rotation out of mega-caps if enacted. The NYSE Fed Funds Rate Index, which tracks the effective federal funds rate, remains stable at 5.33%, but the futures market is pricing in a 75% probability of a rate cut by September. A cut would provide a near-term boost to all stocks, but the benefit would disproportionately flow to the mega-caps that have the most duration sensitivity, deepening the breadth problem before it improves.
What the breadth signal says about the market cycle
The 60% reading above the 200-day average is not just a technical curiosity. It is a strategic signal about where the market is in its cycle. Historically, breadth peaks early in a bull market, when the recovery is broad-based and all sectors participate. As the cycle matures, leadership narrows to a few sectors or themes, and breadth deteriorates even as the index continues to rise. The divergence between internal market health and headline index performance is one of the oldest warning signs in technical analysis — flagged repeatedly by strategists at Goldman Sachs, Morgan Stanley, and JPMorgan in their mid-year outlook notes. The signal is not a timing tool for shorting; it is a guide to position sizing and risk management, telling investors to reduce leverage before the reversal materializes rather than after. This pattern played out in 1999, when the S&P 500 rose 20% while only 50% of stocks were above their 200-day average, and again in 2007, when the index hit its all-time high in October with breadth already in decline. In both cases, the subsequent bear market erased the gains of the preceding two years. The current cycle, which began in October 2022, is now 32 months old. That is roughly the average duration of a bull market since 1950. The Federal Reserve's pivot to a more dovish stance has extended the rally, but the breadth data shows that the easy money has been made. The market is now in a phase where the index can grind higher on multiple expansion in a handful of names, but the risk-reward for the median stock is deteriorating. For institutional investors, the signal is clear: the time to reduce beta and increase exposure to quality factors is now, before the concentration unwind begins.
The path forward depends on whether breadth can recover or will continue to erode. A recovery would require a catalyst that rotates capital out of mega-cap tech and into the broader market. That catalyst could be a sharp drop in oil prices, a resolution to US-Iran tensions that boosts cyclicals, or a Fed rate cut that lifts small-cap valuations. None of these are guaranteed. The more likely scenario, given the current momentum, is that breadth continues to contract until it reaches a tipping point. Historically that tipping point sits around 50%, at which point the index itself begins to decline. For investors, the playbook is not to sell everything but to hedge the tails: increase cash allocations, buy put spreads on the QQQ, and rotate into equal-weight S&P 500 ETFs that capture the median stock's performance rather than the cap-weighted index. The record highs are real, but they are built on a foundation that is narrower than at any point since the dot-com era. Concentration at this scale is not stability; it is fragility with a premium attached. The next 10% move in the S&P 500 will likely be down, not up, and it will happen faster than most expect.
The BossBlog Daily
Essential insights on AI, Finance, and Tech. Delivered every morning at 06:00 Asia/Shanghai. No noise.
Unsubscribe anytime. No spam.