
The SPDR S&P Regional Banking ETF (KRE) has delivered a 28% annual return as regional banks capture widening net interest margins from a favorable Federal Reserve rate path. The equal-weighted fund, trading near $70 per share with a 9% year-to-date gain, reflects a sector benefiting from deposit costs that are finally rolling over while loan yields remain elevated. The 12-person Federal Open Market Committee (FOMC), composed of all seven Fed governors, the New York Fed president, and four of the 11 regional reserve bank presidents on a rotating basis, sets the rate policy that drives this dynamic. But Bank of America warns that a 100-basis-point parallel decline below the forward curve would reduce net interest income by $2 billion over 12 months. For investors, the question is whether the KRE's NIM-expansion thesis can survive a market that is pricing more than two rate cuts in 2026.
FOMC Rotation Reshapes Rate Expectations
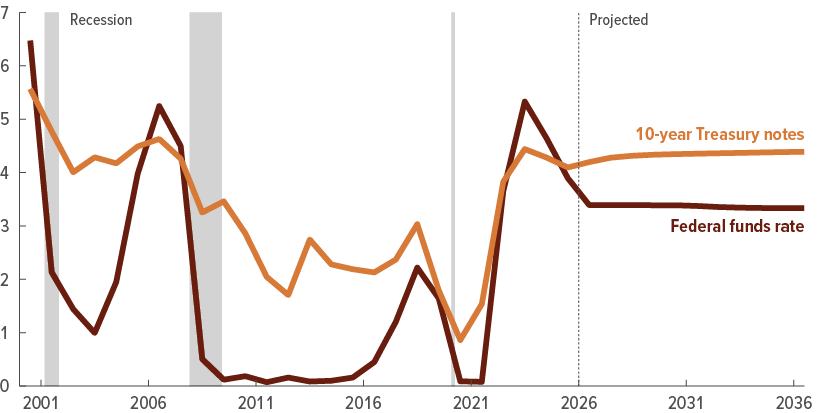
The FOMC's 2026 voting rotation introduces a subtle but meaningful shift in the committee's policy lean. The 12-person body includes all seven Fed governors, the New York Fed president, and four of the 11 regional reserve bank presidents who rotate annually. This year's voting members from the regional banks include presidents from districts with diverse economic profiles, some with hawkish reputations tied to inflation-wary constituencies, others with dovish tendencies reflecting slower-growth regions. The composition matters because regional bank presidents often bring on-the-ground credit conditions and small-business sentiment that directly affect how the committee interprets data from the Bureau of Labor Statistics and the monthly CPI releases. The CME FedWatch Tool currently reflects market pricing for rate cuts, but the dot plot from the last FOMC meeting shows a narrower path than futures markets anticipate. If the 2026 rotation produces a more hawkish voting bloc, the divergence between market expectations and actual policy will widen, directly impacting the rate path that regional banks depend on for NIM expansion. The rotation's effect is amplified because regional bank presidents tend to prioritize local employment and lending conditions over national inflation metrics, meaning a bloc of presidents from manufacturing-heavy districts could push for a different policy stance than one from service-oriented regions. The practical consequence for KRE holders is that the rate-path uncertainty embedded in each new rotation is not just a macro abstraction: it is the single variable that determines whether the 28% annual gain continues or reverses over the following 12 months.
Where the $2 Billion NII Risk Lives
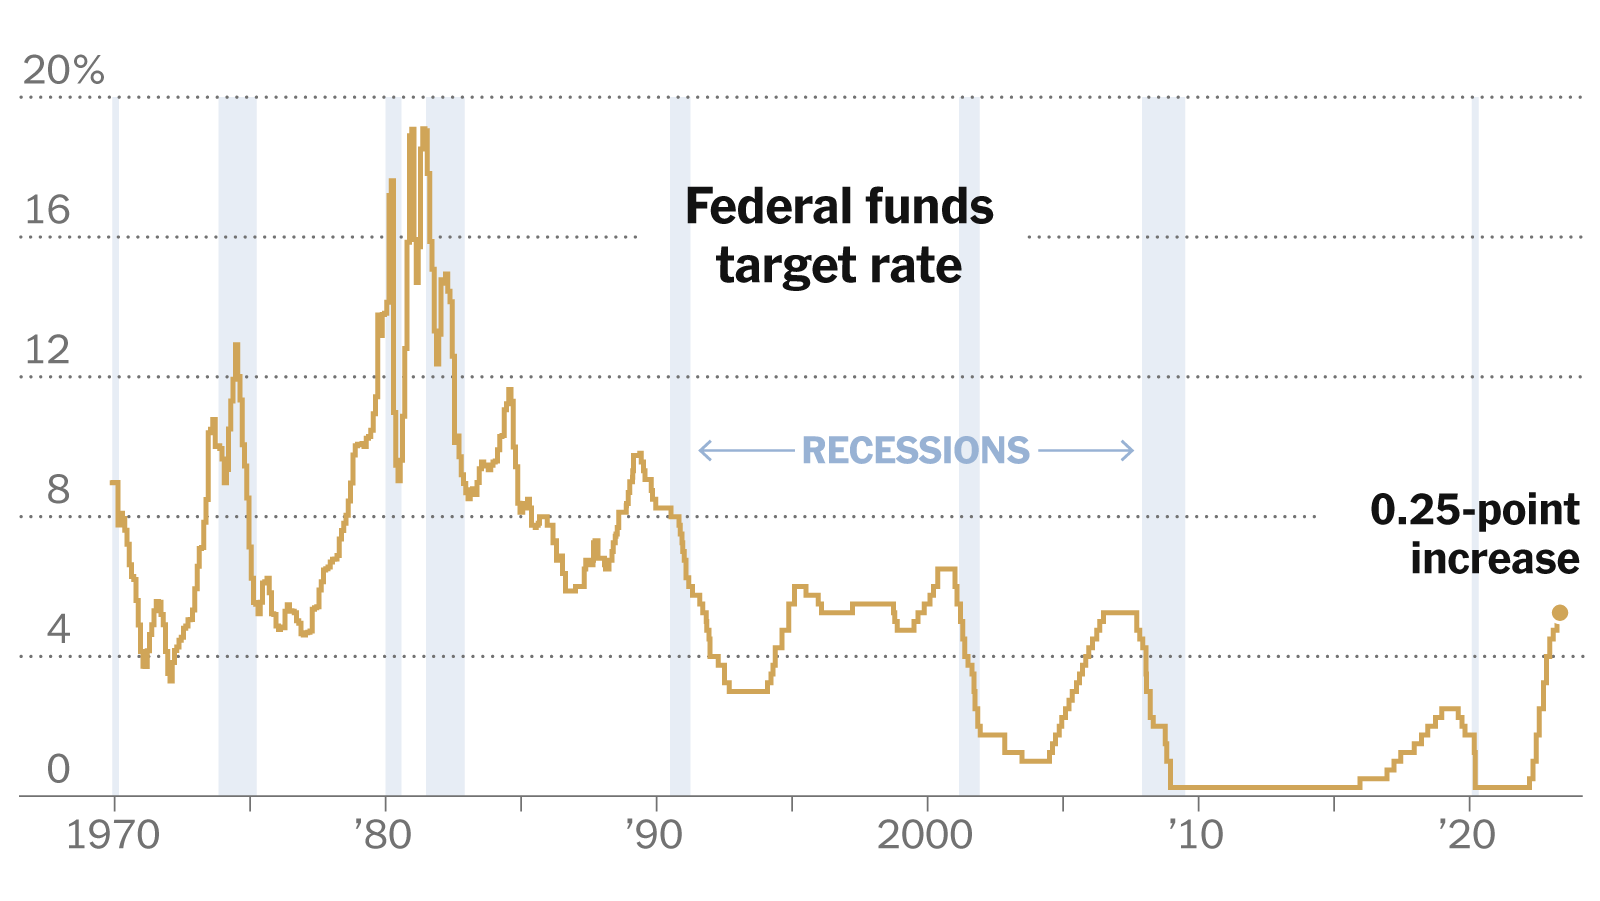
Bank of America's analysis pinpoints the precise vulnerability: a 100-basis-point parallel decline in rates below the forward curve would reduce aggregate regional bank net interest income by $2 billion over 12 months. This risk concentrates in banks with the highest proportion of fixed-rate loans and the lowest deposit beta, institutions that benefited most from the rapid rate hiking cycle but now face the sharpest repricing risk. The KRE's equal-weighted structure amplifies this exposure because it allocates the same weight to smaller lenders with less diversified funding bases as it does to larger regionals. Deposit costs are rolling over, which provides near-term support, but the forward curve already embeds some of that benefit. The $2 billion figure assumes a parallel shift, meaning short-term rates fall in lockstep with long-term rates. If the yield curve steepens, with short rates falling faster than long rates, the damage to NII will be smaller, but the compression on net interest margins will still be material for banks that loaded up on longer-duration assets during the low-rate era. Banks with loan-to-deposit ratios above 90% face the greatest repricing risk because they rely more heavily on wholesale funding that reprices immediately when the Fed cuts.
Bank of America recommends monitoring three signals to gauge when the risk tips from theoretical to operational: the CME FedWatch Tool for real-time market pricing of rate cuts, the FOMC dot plot for the committee's own rate projections, and the monthly CPI releases from the Bureau of Labor Statistics. When markets price more than two cuts in 2026, the NIM-expansion thesis begins to weaken materially. The dot plot is particularly valuable because it shows the range of individual member views, not just the median, and a widening dispersion in 2026 projections would signal that the committee itself is uncertain about the rate path. For investors holding KRE at $70 with a 9% year-to-date gain, the practical implication is straightforward: the fund's performance is not a bet on bank management quality or credit underwriting. It is a leveraged bet on the Fed's willingness to keep rates elevated long enough for deposit cost savings to compound across five or more quarters of net interest income accrual.
Wells Fargo's NIM Compression Versus Regional Expansion
Wells Fargo's net interest margin compressed from 2.67% to 2.47% over the past year, a stark contrast to the expansion many regional peers have enjoyed. The divergence reveals a structural divide in the banking sector: mega-banks with large securities portfolios and wholesale funding bases face different rate dynamics than regionals funded primarily by core deposits. Wells Fargo's NIM compression stems from its outsized securities book, which reprices more slowly than the loan portfolios that dominate regional bank balance sheets. Regional banks, by contrast, have seen their funding costs decline faster than their asset yields as deposit competition eases and the Fed holds rates steady. This gap creates a tailwind for KRE that Wells Fargo cannot capture. But the divergence also signals risk: if the rate path shifts downward, regional banks with the highest NIM expansion will face the steepest compression, while Wells Fargo's NIM has already adjusted to a lower rate environment. The KRE's 28% annual return embeds an assumption that the regional bank advantage persists, an assumption that breaks if the Fed cuts more aggressively than the forward curve currently implies.
CRE Risk and Basel III's Hidden Lever for Buybacks
The KRE's equal-weighted structure gives outsized exposure to commercial real estate lending, a sector under pressure from higher vacancy rates and refinancing risk. Regional banks hold a disproportionate share of CRE loans on their balance sheets, and the Basel III endgame re-proposal will unlock significant buyback capacity by reducing the capital requirements applied to these assets. The original Basel III proposal would have forced regionals to hold more capital against CRE loans, constraining their ability to return capital to shareholders. The re-proposal, which softens those requirements, directly benefits KRE constituents by freeing up capital that can be deployed into share repurchases or dividends. This regulatory tailwind partially offsets the NIM risk from rate cuts, because buybacks mechanically boost earnings per share even if net interest income declines. The market is pricing this dynamic into KRE's valuation, but the actual impact depends on the final rule's treatment of acquisition, development, and construction loans, the riskiest segment of CRE lending where regional banks have the highest concentration. If the re-proposal excludes ADC loans from the capital relief, the buyback boost will be concentrated among banks with more stabilized commercial property portfolios.
What the Fed Rate Path Signals About the Economy
The FOMC's rate decisions are not just technical adjustments; they are the committee's read on the real economy. A path that includes more than two cuts in 2026 would signal that the Fed sees weakening growth or disinflation accelerating beyond its current forecast. For regional banks, this creates a paradox: lower rates compress NIMs, but the economic conditions that justify those cuts could also reduce credit losses and loan demand. The CME FedWatch Tool and the FOMC dot plot provide the market's best guide to this trade-off, but the monthly CPI releases from the Bureau of Labor Statistics will be the decisive data points. If inflation remains sticky above 3%, the Fed will hold rates higher for longer, extending the KRE's NIM-expansion thesis. If inflation falls to 2% and the labor market softens, the committee will cut, and the $2 billion NII risk materializes. The 2026 FOMC rotation adds another layer: the voting members from regional banks may push for a more aggressive response to local economic conditions than the Washington-based governors prefer.
The KRE's 28% annual return has been a bet on a specific rate path, one where the Fed holds rates high enough to sustain NIM expansion but not so high that credit losses spike. That bet is now entering its most dangerous phase. The market is pricing more than two cuts in 2026, which will directly undermine the NIM-expansion thesis that drove the fund's performance. Regional banks face a binary outcome: either the Fed holds rates steady and the KRE continues to benefit from deposit cost rollover and Basel III capital relief, or the committee cuts and the $2 billion NII reduction materializes across the sector. The 2026 FOMC rotation introduces a wildcard, because the voting members from regional reserve banks may push for a more aggressive response to local economic conditions than the Washington-based governors prefer. For investors, the KRE's performance over the next six months will depend less on quarterly earnings and more on the monthly CPI releases and the dot plot's evolution. The fund's equal-weighted structure means that a few high-beta names could drive outsized gains or losses, but the aggregate outcome hinges on the Fed's reading of the real economy. KRE's current position at $70 per share, 9% year-to-date, reflects a market that is still net bullish on the NIM story. The next CPI print will test that conviction directly. If inflation remains stubborn above target, the Fed holds and regional bank margins keep widening. If disinflation accelerates, the dot plot shifts downward and the $2 billion NII risk becomes a realized line-item across bank income statements. The equal-weighted structure offers no escape: every constituent faces the same rate-path dependency, and the Basel III capital relief, however welcome, does not offset three or four consecutive rate cuts compounding across back-to-back quarters of tightening NIM.
The BossBlog Daily
Essential insights on AI, Finance, and Tech. Delivered every morning at 06:00 Asia/Shanghai. No noise.
Unsubscribe anytime. No spam.
Tools mentioned
AffiliateSelected partner tools related to this topic.
AI Copilot Suite
Content drafting, summarization, and workflow automation.
Try AI Copilot →
AI Model Monitoring
Track model quality, latency, and drift with alerts.
View Monitoring Tool →
Low-fee Global Broker
Multi-market access with transparent pricing.
Open Broker Account →
Some links above are affiliate links. We earn a commission if you sign up through them, at no extra cost to you. Affiliate revenue does not influence editorial coverage. See methodology.
The BossBlog Daily
Essential insights on AI, Finance, and Tech. Delivered every morning at 06:00 Asia/Shanghai. No noise.
Unsubscribe anytime. No spam.
Tools mentioned
AffiliateSelected partner tools related to this topic.
AI Copilot Suite
Content drafting, summarization, and workflow automation.
Try AI Copilot →
AI Model Monitoring
Track model quality, latency, and drift with alerts.
View Monitoring Tool →
Low-fee Global Broker
Multi-market access with transparent pricing.
Open Broker Account →
Some links above are affiliate links. We earn a commission if you sign up through them, at no extra cost to you. Affiliate revenue does not influence editorial coverage. See methodology.